My blog has moved!

You will be automatically redirected to the new address, all posts have been transferred from this blog. Use site search to find them. If that does not occur, visit
http://www.ianhopkinson.org.uk
and update your bookmarks.

Showing posts with label politics. Show all posts

Tuesday, June 28, 2011

Universities and knowledge

**I’ve moved my blog to http://www.ianhopkinson.org.uk/, this post can be found here**

The Higher Education White Paper is published today, in common with all other commentators in this area I have not read it either. One thing which seems to have attracted comment is the idea that there should be a market in higher education. The academics don’t seem to approve.

But knowledge doesn’t belong to universities. Universities provide qualifications, accreditation, and they provide personalised teaching.

For many students, such as myself 20 years ago, a university education was a given: it was the middle class way of easing myself out of the parental home and the gateway to the career I have now – first as an academic and now as an industrial research scientist. It was available to a relatively small fraction of the population. Things have changed now, increasingly university is seen as the gateway to most careers. Students do not go to university for the love of knowledge, they go because they must to get the careers they want. Pragmatically many careers do not require three years of post-18 education but we are manoeuvring ourselves in to a position where we say they must.

Students will no doubt see themselves in a market – even before this white paper they were being asked to commit significant future income in paying for three years of education, they are foregoing three years of paying work for the promise of a better future. If I were a student I’d be a bit peeved that the university sector were not at least showing willing in making that burden lighter.

Universities don’t give us knowledge – that’s down to us as individuals to hunt out, universities give us the tools to do that and the bit of paper that says we can do that.

Sunday, May 29, 2011

House of Lords Reform

At the 2010 General Election nearly 90% of us voted for parties enthusiastic for an elected House of Lords. The Conservatives said in their manifesto:

"We will work to build a consensus for a mainly-elected second chamber to replace the current House of Lords"

The Liberal Democrats said in their manifesto:

"Replace the House of Lords with a fully-elected second chamber with considerably fewer members than the current House."

And Labour said in their manifesto:

"We will ensure that the hereditary principle is removed from the House of Lords. Further democratic reform to create a fully elected Second Chamber will then be achieved in stages."

This is also reflected in the Coalition Agreement:

"We will establish a committee to bring forward proposals for a wholly or mainly elected upper chamber on the basis of proportional representation."

The reasons for this unanimity is several-fold:

  1. There is a current pressing problem of overcrowding of the House of Lords. This arises because although there is a mechanism for appointing Lords there is no mechanism for retiring them, as a consequence Britain has one of the largest legislatures in the world relative to the population. The convention in recent years has been to add members such that the composition of the house reflects the proportion of votes for each party at the most recent general election - with no exit route this is unsustainable.
  2. The British scheme of appointing a second chamber is almost unique in western nations, with only Canada following suit, it’s wholly appointed nature raises serious questions of democratic legitimacy. Attempts to make the composition match recent elections are a recognition of this lack of legitimacy but are an inadequate solution to the problem.
  3. The appointed nature of the House of Lords leads to transparency issues. It serves in part as an honours system for services rendered to political parties as well as a working revision chamber. Although the current composition contains 23% crossbenchers it is still very substantially a political chamber.
  4. The current average attendance in the House of Lords is around 388, nearly 20% of members only attend once or twice a year.

The Labour government made a start on House of Lords reform by removing the voting rights of all but 92 of the hereditary peers with an intention of moving to a House of Lords with a larger elected component. These subsequent changes ran into the sands of complex parliamentary procedures and an obstinate upper House.

The proposals put forward by Nick Clegg, backed by David Cameron, are for a second chamber containing 300 members elected using a proportional system based on large constituencies. The proposal is to elect one third of the house at each general election with members elected for 15 years but no possibility of re-election. The draft bill includes provision for 20% of the house to be appointed but there is a consultation with the option that the house be 100% elected.

These proposals are evolutionary: the legislative powers of the House of Lords remaining as now; an elected house is only attained after 15 years and the membership will only be 25% smaller than the current active membership.

I look forward to the parties at Westminster fulfilling their commitments to an elected second house!

Sunday, May 22, 2011

The House of Lords by numbers

Reform is in the air for the House of Lords, to be fair reform has been in the air for large parts of the last hundred years. Currently reform comes in the form of a proposal put forward by Nick Clegg and backed by David Cameron – you can see the details here. It comes in the context of all three main Westminster parties supporting a largely elected House of Lords in their 2010 General Election manifestos.

The purpose of this post is not to go through the proposals in detail but simply to provide some charts on appointments to the House of Lords over the years. The current composition of the House is shown in the pie-chart below:

CurrentComposition

The membership of the House of Lords currently numbers 789, I have excluded the handful of members from UKIP, DUP, UUP, the Greens and Plaid Cymru since they are too few to show up in such a chart.

The website www.theyworkforyou.com provides a handy list of peers in an easily readable format, this list includes data such as when they were appointed, what party they belong to, what name they have chosen and when they left and whether they used to be an MP. We can plot the number of appointments each year:HoLTotalByYear

I’ve highlighted election years in red, as you can see election years are popular for the appointment of new members, and it would seem many of those appointed in such years are former MPs, as shown in the graph below:

HoLexMPs

But to which parties do these appointees belong? This question is answered below:

HoLTotalByYearAndParty

I hope this provides a useful backdrop to subsequent discussions on reform.

Thursday, May 19, 2011

More news from the shed…

CWACResults2011

In the month of May I seem to find myself playing with maps and numbers.

To the uninvolved this may appear to be rather similar to my earlier “That’s nice dear”, however the technology involved here is quite different.

This post is about extracting the results from the local elections held on 5th May from the Cheshire West and Chester website and displaying them as a map. I could have manually transcribed the results from the website, this would probably be quicker, but where’s the fun in that?

The starting point for this exercise was noticing that the results pages have a little icon at the bottom saying “OpenElectionData”. This was part of an exercise to make local election results more easily machine-readable in order to build a database of results from across the country, somewhat surprisingly there is no public central record of local council election results. The technology used to provide machine access to the results is known as RDF (standing for Resource Description Framework), this is a way of providing “meaning” to web pages for machines to understand - this is related to the talk of the semantic web. The good folks at Southampton University have provided a browser which allows you to inspect the RDF contents of a webpage. I used this to get a human sight of the data I was trying to read.

RDF content ultimately amounts to triplets of information: “subject”,”predicate”,”object”. In the case of an election then one triplet has a subject of “specific ward identifier” the predicate is “a list of candidates” and the object is “candidate 1;candidate 2; candidate 3…”. Further triplets specify the whether a candidate was elected, how many votes they received and the party to which they belong.

I’ve taken to programming in Python recently, in particular using the Python(x,y) distribution which packages together an IDE with some libraries useful to scientists. This is the sort of thing I’d usually do with Matlab, but that costs (a lot) and I no longer have access to it at home.

There is a Python library for reading RDF data, called RDFlib, unfortunately most of the documentation is for version 2.4 and the working version which I downloaded is 3.0. Searching for documentation for the newer version normally leads to other sites where people are asking where the documentation is for version 3.0!

The base maps come from the Ordnance Survey, specifically the Boundary Line dataset which contains administrative boundary data for the UK in ESRI Shapefile format. This format is widely used for geographical information work, I found the PyShp library from GeospatialPython.com to be well-documented and straightforward way to read the format. The site also has some nice usage examples. I did look for a library to display the resulting maps but after a brief search I adapted the simple methods here for drawing maps using matlibplot.

The Ordnance Survey Open Data site is a treasure trove for programming cartophiles, along with maps of the UK of various types there’s a gazetteer of interesting places, topographic information and location data for UK postcode.

The map at the top of the page uses the traditional colour-coding of red for Labour and blue for Conservative, some wards elect multiple candidates and in those where the elected councillors are not all from the same party purple is used to show a Labour/Conservative combination and orange a Labour/Liberal Democrat combination.

In contrast to my earlier post on programming, the key elements here are the use of pre-existing libraries and data formats to achieve an end result. The RDF component of the exercise took quite a while, whilst the mapping part was the work of a couple of hours. This largely comes down to the quality of the documentation available. Python turns out to be a compact language to do this sort of work, it’s all done in 150 or so lines of code.

It would have been nice to have pointed my program to a single webpage and for it to find all the ward data from there, including the ward names, but I couldn’t work out how to do this – the program visits each ward in turn and I had to type in the ward names. The OpenElectionData site seemed to be a bit wobbly too, so I encoded party information into my program rather the pulling it from their site. Better fitting of the ward labels into the wards would have been nice too (although this is a hard problem). Obviously there’s a wide range of analysis that can be carried out on the underlying electoral data.

Footnotes

The python code to do this analysis is here. You will need to install the rdflib and PyShp libraries and download the OS Boundary Line data. I used the Python(x,y) distribution but I think it’s just the matlibplot library which is required. The CWac.py program extracts the results from the website and writes them to a CSV file, the Mapping.py program makes a map from them. You will need to adjust file paths to suit your installation.

Sunday, May 08, 2011

Post-election Reflection 2011

A year into the Coalition and in the aftermath of some rather poor electoral results for the Liberal Democrats I thought I should write down some thoughts from the perspective of a Liberal Democrat of 20 years.

On May 5th the LibDems lost nearly 700 local councillors from an original population of 1751 and 9 of 19 councils, 12 of 17 seats were lost in the Scottish parliament and there was an emphatic "No to AV" in the referendum. At a personal level, I was involved in the campaign for the Cheshire West and Cheshire council, where ultimately we polled 12% of the votes and got 1.3% of the seats. This is a reduction from 4 seats to 1, although in a reconfigured council.

Why did this happen?

The LibDems were in a relatively good position based on the last occasion these council seats were contested, having steadily picked up seats from Labour through the years of Labour government 1997-2010, in particular from 2001 onwards. Our previous standing reflected a popular vote of around 23%, currently our opinion poll standings are around 15%.

In this sense it should not be seen as "electorate punishing LibDems for coalition" rather "former Labour supporters returning to Labour now it's out of power", similarly talk of LibDems being human shields for the Tories is not a particularly useful analysis. Tories and LibDems have different electorates, the Tory electorate is clearly happy with the Coalition, the LibDem electorate less so. Looking at the overall results with the Tories on 38% of the vote, Labour on 37% and LibDems 17%, we're actually above the top end of our current opinion poll ratings with a share of the vote between our 1997 and 2001 general election result.

Also popular in the news is the idea that Nick Clegg must go as leader of the Liberal Democrats, if you rummage around amongst several hundred rather bruised (ex-)local councillors you are bound to find a few who'll agree with this but it is idiocy for several reasons:

  • Nick Clegg got strong party backing for going into the Coalition from MPs, the federal executive and a special conference. We all stand with Nick, the idea that he has led the party off at the head of an Orange Book clique is a fantasy built by Labour, familiar with this type of internal schism.
  • Our drop in the opinion polls was pretty much inevitable as soon as the Coalition agreement was signed, regardless of anything any leader could have done: we dropped 2 points from the 23% showing at the election almost immediately, and then by mid-late summer were down to 18% even before the tuition fees issue had really hit.
  • A new leader at this point would continue to take the blame for simply being in coalition and leave us in no better position at the next general election.

The no to AV result was a disappointment, not because of the rejection of AV itself but because it likely rules out electoral reform for years to come. I thought Nick Clegg struck the best note on this, close to the end of the campaign when he said this was just a small change. I found Ed Miliband's refusal to share a platform with Nick Clegg in support of the Yes campaign deeply unhelpful, listening to him try to justify this having just explained to John Humphries how AV forced politicians to reach out to other parties was entertaining; as was his jaw-dropping hypocrisy in justifying Labour's failure to implement AV in 13 years of government as being because they'd won a 170 seat majority under first-past-the-post - remember this when he bleats about the "progressive majority".

I note that over on ConHome the Tories are trying to claim that Labour made them make Nick Clegg the target for the No campaign. This seems to me a rather spineless statement - they funded the No to AV campaign, they could have called the shots. They should realise how massively they have pissed off a large chunk of pro-Coalition LibDems, and that there will be consequences for this. Going forward we should be looking at each item we have on the Coalition Agreement and asking ourselves: can we trust the Tories to support implementation of this? If the answer is "no" then we should be looking to bargain with something in the coalition agreement that they hold dear and not let it pass until our target has been achieved.

Obviously another election brings another crude pass at Liberal Democrat ministers by Ed Miliband, like a creepy uncle at a wedding party. This is entirely for his own supporters and has nothing to do with the Liberal Democrats, as Ed has said before - he seeks our extinction. We should all bear this in mind when he talks about "progressive alliances".

I don't see the point in believing that we can now go to the Tories for concessions because we have lost some elections, it seems needy and unnecessary to me. Similarly I don't see much mileage in fiddling around with the infantile "getting into bed with" and "marriage" metaphors. Vince Cable and Chris Huhne have prototyped the "cooperating but sulkily" look and, to be frank, it is unedifying.

Liberal Democrats have succeeded in getting policy implemented over the past year in Coalition: in getting the income tax threshold raised, in linking pensions to earnings, in providing some protection to the poorest students through the Pupil Premium, in reducing the 28 days detention without charge to 14 days, in reducing dramatically, (if not entirely eliminating) child detention for failed immigration claimants. There is some interesting analysis by the University of Essex on how much of the Liberal Democrat manifesto got into the Coalition agreement. If you want to see a more detailed comparison here is a document on the Guardian Datablog which analyses, in detail the Coalition agreement. Or there is a document produced by the Party here.

Now is a bloody awful time to be in government, there is no money to spend on cherished schemes, rather an absolute need to cut pretty much the largest deficit in the world, left behind by a Labour government desperately trying to spend it's way to salvation but we're getting on and doing it. It's worth remembering that at this point Labour would have been making 7/8ths of the cuts currently being made by the Coalition (under the Darling plan) - difficult to believe given their current statements.

Despite all of this, it is still the best time it has ever been to be a Liberal Democrat since I joined the party in 1991.

Saturday, April 16, 2011

The elephant in the room

comparison

In my last blog post I wrote about the AV referendum and party political self-interest. Before that I wrote about AV, preference and how parties hold their internal elections.

In this post I will just explain the chart at the top of the page.

It shows the number of parliamentary seats each of the three main national parties gained in the UK 2010 General Election under first-past-the-post (FPTP) – these are the blue bars. The red bars show the number of seats each party would expect to gain under Alternative Vote (AV), based on a mock election involving 13,000 people. Finally the yellow bars show the number of seats which would be obtained under a proportional system.

The proportional system, where the number of seats is proportional to the number of votes gained nationwide, is what I would call “fair”.

Labour and Tory parties both benefit significantly under the current FPTP system and proposed AV systems.

Thursday, April 14, 2011

Self-interest and electoral perversions

In this post I will argue that all of the political parties are arguing the case for AV in their own self-interest, this is very obviously what they are doing and admitting such will make a change.

I’d like to start with the electoral system as it stands today:

Two things are going on at an a general election: there are “local” elections in 650 constituencies which determine which individual represents each constituency in parliament and then there is the government formed as the result of this set of elections. Once elected to parliament MP’s represent their constituents interests but vote largely as whipped by their political party.

First past the post (FPTP) and Alternative Vote (AV) are both algorithms for determining local representation: they make no deliberate effort to make the output of a collection of constituencies proportional to the proportion of votes cast for a particular party across the country. The degree to which they give proportionality is dependent on the spatial distribution of voters for each party across the country and the locations in which electoral boundaries are drawn1. The current distribution of party support is not far off the point where it can give completely perverse results with the Liberal Democrats gaining the largest fraction of the popular vote and the fewest parliamentary seats and Labour gaining the smallest fraction of the popular vote and the largest number of parliamentary seats2.

The FPTP system acts to supress the formation of more than two political parties, this is known as Duverger's law. You can see this in action in the UK, with the separation of the SDP from Labour in the early 1980’s, gaining a large fraction of the popular vote: approaching that of Labour, but nothing like the same number of seats3.

Best estimates for AV in a UK general election are that the Liberal Democrats will gain seats in a Westminster election and Labour and the Tories will lose some, it isn’t particularly clear who will lose most.

So moving on to the self-interest of parties:

The Liberal Democrats are in favour of AV because they will get more seats, this is OK because they will still have far fewer seats than their proportion of the vote should allow.

The Tories are against AV because they believe that they will lose seats to the Liberal Democrats for the same share of the vote, and that Labour-Liberal Democrat coalitions are more likely than Tory-Liberal Democrat coalitions. Wait! What?

Labour is split on AV, this is because some believe that Labour-Liberal Democrat coalitions are more likely than Tory-Liberal Democrat coalitions, and the Tories could be basically locked out of power for ever. Others in Labour, on the left of the party, believe that the Socialist utopia should be pure and that coalition is anathema and so oppose AV.

UKIP is in favour of AV because they believe that they will be first preference for a number of people who vote Tory tactically and second preference for a number of Tories. Their visibility will rise, even if it doesn’t lead to much increase in seats.

The Greens are in favour of AV because they believe they will pick up second preferences from Liberal Democrats and Labour.Their visibility will rise, even if it doesn’t lead to increased seats.

The BNP is against AV because it judges that it will not pick up second preferences from anyone. It decreases the likelihood of them gaining seats even if it increases the visibility of the party. The BNP is entirely visible already but for the wrong reasons.

Oddly those on either side of the debate are able to draw on arguments that match the self-interest of their parties. What is the non-aligned voter to make of this?

Footnotes

  1. Oxford is a nice example of this: across the two Oxford parliamentary seats (Oxford East and Oxford West and Abdingon) the number of votes for the three main parties are (LibDem: 41087, Tory: 33633, Lab: 27937. The two constituencies return a Labour and a Tory MP.
  2. Don’t believe me? Put Tory: 33.2%, Labour: 27.2%, LibDem: 27.7% Other: 11.9% into this BBC seat calculator. The actual result was Tory: 36.1%, Labour: 29.0%, LibDem: 23.0% Other: 11.9%
  3. The 1983 General Election. Vote share: Tory: 42.4% Labour: 27.6% SDP+Liberal Alliance: 25.4% Number of seats: Tory: 397 Labour: 209 SDP+Liberal Alliance: 23.
  4. Given 1-3, on what basis is it that we claim to live in a democracy?

Monday, April 11, 2011

Yes to AV!

Alongside the local elections on the 5th May, we will all have an opportunity to vote in a referendum on voting reform*. The choice is between keeping the current system, First Past the Post (FPTP) or switching to the Alternative Vote (AV) system.

The Liberal Democrats use Single Transferrable Vote (STV) to elect their leaders. Labour uses straightforward AV. The Tories use a system to elect their leader which is substantially equivalent to AV: a ballot is taken with all candidates standing; if more than two candidates are standing then the last placed candidate is knocked-out and the ballot is repeated – this process is continued until only two candidates remain. In this two candidate election the candidate with most votes wins. The Tories could have used a straightforward FPTP system, but they didn’t: if they had then David Davies, not David Cameron, would have won the 2005 leadership election.

AV is substantially similar to this process of successive ballots but rather than a sequence of ballots, a single ballot is held with voters ranking candidates by preference. In common with the Tory system, the last candidate is eliminated after the first ballot but rather than return to the electorate for another round of voting the second preferences of the people who voted for the loser are inspected and votes redistributed accordingly. This process is repeated until one candidate has more than 50% of the votes.

The Tory leadership election is not identical to AV because the electorate can switch votes between rounds, whilst in an AV election the rankings are chosen and frozen at the time of the first (and only) ballot. With electorates of tens of thousands the Tory leadership system could not be used for parliamentary constituencies without substantially increased cost and time taken to conduct the election, I will assert that it would produce the same result as AV.

These political sophisticates have rejected FPTP as a method of choosing who represents them, why do so many of them not support the same for us?

AV will not bring great changes to our elections, the majority of constituencies would return the same MP under AV as they currently do under FPTP. The benefit of AV over FPTP is that tactical voting, where you attempt to encode your preferences with a single X by second guessing who everyone else will vote for, becomes largely irrelevant.

We are not being given a choice between FPTP and an ideal electoral system, we are not being asked whether AV is a perfect system for voting, we are being given a choice between FPTP and Alternative Vote. Personally I would prefer a system of proportional representation, but that isn’t on offer.

In the absence of a better choice I will vote “Yes to AV”!

*The BBC have apparently banned themselves from describing the choice of AV over FPTP as “reform”

Thursday, January 13, 2011

Book Review: The Third Man by Peter Mandelson

TheThirdManA little bit of politics for this book review: “The Third Man: Life at the heart of New Labour” by Peter Mandelson. It’s been a while since I’ve read much politics; I did go through a spell of reading various diaries and biographies (Alan Clark, Tony Benn, John Major, Churchill) a number of years ago but gave up largely because the diarists and autobiographies seemed unwilling to accept they were wrong on anything, and I had a nasty experience with the biography of Gladstone.

I’m sort of fond of Peter Mandelson, I never really bought the Prince of the Dark Arts thing and he seems to be one of the more coalition minded senior Labour figures.

The book covers briefly Mandelson’s early life but the main focus of the book is the personal relationship between Tony Blair, Peter Mandelson and Gordon Brown from the late eighties all the way through to the 2010 election. Peripherally it is also the story of New Labour: firstly, a switch to a more professional presentational style, followed by the scrapping of Clause IV then it seems to go a bit vague in terms of a guiding policy theme. Mandelson states the central vision of New Labour being of fairness and social justice: but these are ideals I’m sure the Liberal Democrats would cleave to and the Tories would claim the same. Ultimately ideology is not helpful in discriminating between parties rather implementation of policy and no-one is really grasping the nettle of going for excellent implementation.

I’d always assumed that poor press for Labour ministers was as a result of biased media and some mysterious influence from the Tories that I hadn’t entirely thought through. Mandelson makes it pretty clear that the worst press for Labour came from Labour ministers and their hangers-on briefing against each other!

The central theme of the book was how awful the relationship between Brown and Blair was, lasting for many years and seriously hampering a New Labour programme for reform. The origin of this poor relationship is in the leadership struggle which took place following the death of John Smith in 1994. Communication between the Prime Minister and the Chancellor was poor, and they often seemed to be working largely to block each other. This makes hard reading, it’s like the story of a couple trapped in a loveless marriage “for the sake of the kids”. In some ways I find this disturbing: New Labour effectively provided it’s own opposition whilst in government in the sense that it limited their ability to make policy and enforce change on public services. What happens when the Prime Minister and the Chancellor are working to the same agenda?

Clearly as a Liberal Democrat I’m interested in what he has to say about us, the truth is: not much. There seems to be a degree to which Mandelson and Blair held key early members such as Roy Jenkins in high regard, seeing them as something of a lost tribe who had left the Labour party in the early eighties believing it to be un-reformable. He also describes the talk toward involving the Liberal Democrats in government following the 1997 election, eventually floundering because ultimately there was no need to give anything to the Liberal Democrats. It does seem that there was some quiet local arrangements where Labour or Liberal Democrats agreed not to fight too hard against each other at general elections. I suspect things have changed in both parties now, Liberal Democrats and Labour members of my generation and younger joined well after the split so for us the “progressive alliance” is something of an old man’s tale.

What also comes through for me is how grateful Labour should be for our electoral system, in the 1983 election when Labour polled 27.6% and the SDP-Alliance polled 25.4% they still gained 209 seats as opposed to the meagre 23 that the SDP-Alliance achieved. Similarly at the 2010 election, the Conservatives lead Labour by 7.1% in votes but only 48 seats whilst in 2005 Labour led Tory by just 2.8% but gained a 157 seat lead over the Conservatives giving them a firm majority.

Mandelson’s description of the Coalition negotiations following the May 2010 General Election are consistent with the Laws and Wilson books which I reviewed previously. Labour had not made any pre-election plans for coalition, which I still find odd since Peter Mandelson clearly saw the possibility of a hung parliament; the Labour party was split on whether they should make the attempt and ultimately there was a recognition that the parliamentary arithmetic did not add up.

It’s clear that the current theme of “no cuts” from Labour is a continuation of the Brown policy pre-election, Alastair Darling appears to have made considerable efforts to reach a budget which made at least some effort to start addressing the deficit in the final days of the previous government, in the teeth of enormous opposition from Gordon Brown whilst other members of the team such as Ed Balls were keen to make further spending commitments. Brown’s great fear seemed to have been being labelled a “tax-and-spend” Chancellor, who seems to have ended up a “spend” Chancellor and in the long term that does not add up.

Is this a good book to read? It is if you want to know about the personal relationship at the core of the book, and if want to know more about Peter Mandelson. I’m tempted to read Andrew Rawnsley’s “The End of the Party” for a more detached view.

Monday, January 10, 2011

An electoral thought experiment

This morning I asked the good people of twitter:

Anybody else playing #fantasyAV? What would you vote under AV in the by-election in Oldham East & Saddleworth on Thursday?#yes2av

You can follow the responses to this question here. AV in this context is the “Alternative Vote” system, voters rank the candidates on the ballot paper using as many or as few numbers (1,2,3…) as they wish. My response to this question is:

  1. Liberal Democrat
  2. Tory
  3. Green

If you’re interested in my rationale then, as a committed, LibDem 1. is unsurprising! As a supporter of the Coalition then 2. also makes sense. 3. Is because I sort of like the Greens, although Caroline Lucas occasionally slips into “ConDem” mode she has at least made some attempt at providing policy alternatives.

The aim of such experiments is to reveal an underlying truth or at least think clearly about such truths. In this instance applying this to a concrete example helps make the proposal to move to the AV system real, it obliges you to think about what you’d actually do. For me the nice thing about AV is that my vote reflects my preferences for the outcome of the election, I’d like the LibDem candidate to win, I’d be happy if the Tory won and although I may not always agree with them I’m happy to show some support for the Green candidate. I can do all of this under AV without attempting to second guess what other people are going to vote in order to get my most preferred outcome given their votes, which is what I’m stuck with when the first-past-the-post system is used. In this particular by-election I imagine this issue is most acute for Tory voters, some fraction of them would prefer the LibDem candidate if their own candidate does not win. Under AV the answer is simple vote 1. Tory and 2. LibDem, under FPTP the answer to your voting dilemma is not clear.

Put another way AV is about getting more data from the voter. Under first-past-the-post I put one X in one box – very little data is transmitted from me, the voter. Under AV I get to put numbers, not just a single pre-literate mark, into more boxes, therefore more data is transmitted. There is a technical field of “Information Theory” which would tell you precisely how much more information is being transmitted. To use an example from my job, if we are trialling new products we will often ask consumer panels to rank variants rather than simply select their favourite because ranking gives us more information.

I won’t attempt to analyse the results of the responses I received in electoral terms. The “No to AV” campaigners steadfastly refused to accept they had anything other than a single preference. Others placed less mainstream choices such as the Pirate Party and the Greens before other parties. As someone pointed out: “Its already showing the liberating effect AV would have”. As a result of their rankings I learnt more about what they wanted the outcome of the election to be.

Personally I’d like to see a fully proportional system where the number of seats a party gains in parliament reflects the number of votes cast for that party. However, that system is not on offer. AV at least allows us to be honest in our voting, you give the highest rank to your favourite candidate.

What would you vote under AV in the by-election in Oldham East & Saddleworth on Thursday?

Sunday, December 05, 2010

27 days to power in May

This is a joint review of the books "22 days in May" by David Laws and "5 days to power" by Rob Wilson on the negotiations to form the Coalition government following the May 2010 General Election. The Laws book is his personal account of those negotiations, and his subsequent brief period in office. The Wilson book is drawn more widely, although he is a Conservative MP. The title of this blog post is a search engine unfriendly mashup of the two titles.

The Liberal Democrats started planning for negotiations in the event of a hung parliament towards the end 2009, this was done secretly by Danny Alexander, David Laws, Chris Huhne and Andrew Stunell on the direction of Nick Clegg. Their consensus, pre-election, was that depending on electoral arithmetic a coalition with Labour or a "confidence and supply" with Tories were the best outcomes for the hung parliament regime where no party had an overall majority. However, Chris Huhne argued that coalition with the Tories was better than "confidence and supply". Confidence and supply means that the junior party supports the senior for votes of confidence, and for budgetary votes. Huhne argued that under these circumstances LibDems would get all of the blame for difficult government decisions which they supported, without any say over policy. The Tories set up a similar group approximately two weeks before the election comprising William Hague, Ed Llewellyn, George Osborne and Oliver Letwin. Labour apparently did no group planning, their negotiating team comprised Lord's Mandelson and Adonis (a former LibDem), Ed Balls, Ed Miliband and Harriet Harman. The civil service also seems to have been very well prepared to support negotiations and had a strong preference for coalition over other forms of government. There are strong hints that the civil service were deeply concerned at the prospect of a minority government, or a "confidence and supply" agreement would be bad for confidence in the economy.

The 2010 general election gave the Tories 306 seats, Labour 258, Liberal Democrats 57 and other parties 28 seats (including 8 DUP, 6 SNP, 5 Sinn Fein). This would give a Lib-Lab pact a majority over the Conservatives of 8 seats but with 28 votes with smaller parties so not technically a majority. A Tory-LibDem coalition gives 363 seats, with a majority over Labour of 105. Such a pact can take a rebellion (i.e. MPs of the coalition voting against it) of 35, in theory a Lib-Lab coalition could take no rebellion. In practice the 5 Sinn Fein MPs would likely not vote and the SNP would be unlikely to vote with Tories, except if there was something in it for Scotland.

This electoral maths suggest to me that the only real choice was what form the agreement with the Tories should take: no agreement - likely leading to a new election, "confidence and supply" or full coalition. Coalition with Labour looked really hairy in terms of numbers of seats but there was a lot of enthusiasm in the Liberal Democrats and some enthusiasm in Labour for this. The generation of LibDem MPs who had entered the parliament opposing Tory governments (Paddy Ashdown, Vince Cable, Charles Kennedy, Don Foster etc) were particularly keen. Gordon Brown was keen to form a coalition, and from the Labour team Mandelson and Adonis. Clearly from a negotiating point of view the fact that a coalition with Labour was feasible was a strong card to play.

Steve Richards, in The Independent, prefers to characterise the Coalition agreement between LibDem and Tory as the result of a take over by Orange Book Liberal Democrats, against the will of the party. This seems to misunderstand the internal workings of the party: both the parliamentary party (Commons and Lords) and the federal executive were consulted at the time on how negotiations should progress. They also voted on the outcome, as did the wider membership at a special conference held shortly thereafter. Many of these would be people just like me who would have been nervous of coalition with Tories, and many would have initially preferred coalition with Labour. However, ultimately all of these groups voted emphatically for coalition with the Tories. One striking thing in the whole process was the amount of time the LibDems spent on internal consultation - Labour apparently did none of this, and in the Tory party it was cursory and ad hoc.

Lord Adonis has disputed David Laws assertion that the Labour team were disengaged and unhelpful in the negotiating process, and largely supported the Richards view of an Orange Book take over. Laws has responded to that accusation. Personally I'm happy to accept David Laws view of the Labour stance in negotiations: the external signs from Labour were that there was a substantial lack of will to form coalition in the parliamentary party (Blunkett, Reid, Burnham, Darling apparently all against), and that little or no preparation had been made to try to negotiate a coalition should the opportunity arise. Why was this? Was it an oversight? Did they feel formation of a coalition with the Liberal Democrats was so trivial as not to require any preparation? The accusation that the Labour negotiation team may have been split flies because it is so self-evidently plausible. My view is that the Labour party as a whole were tired of government, could not face coalition with a non-existent majority and could not face the prospect of implementing the cuts required (and promised by them too) to address the deficit. There's no doubt that for some of them coalition with any other party, except with the most supine partner was anathema.

David Laws book is the one to read for LibDems or those wishing to understand LibDems better, the Wilson book is better for a more rounded view of the formation of the coalition. His tone with regard to his dear leader is somewhat grating but I'm sure others would say the same of the Laws book. A full account of the negotiations from the Labour perspective would be useful.


A vignette that I've not seen reported elsewhere: George Osborne offered David Laws a post in the shadow cabinet in 2004 and a cabinet post, were he to defect. Laws refused.


Wednesday, December 01, 2010

Tuition Fees

Since I am repeatedly in the position of discussing tuition fees on twitter, I thought it helpful to put down my thoughts in one place without the 140 character constraint.

I'm in favour of supporting universities, and students, via general taxation because the benefits of university education are public: they benefit all of us. I, along with many others, benefited directly from a free university education 20 years ago. I, along with other people and companies, currently benefit from university trained lawyers, nurses, doctors, engineers and so forth, regardless of my own education. I believe that the higher education system should be reformed to separate teaching and research, and also that we should consider all post-18 training in the context of any reforms to university education i.e. we should not distinguish between plumbers and physicists - they are equally valuable. As I watched water freely flowing from a burst pipe last winter, I strongly believed the former more valuable than the later.

The Liberal Democrats have been very tied up over tuition fees because they signed a pledge to vote against tuition fees, largely it has been asserted that the pledge on fees indicates that it takes priority over all other manifesto pledges. In retrospect it would have been wise not to make such a pledge which could so easily invite such a distinction. In their defence I think it illustrates that LibDem MPs did not anticipate fully finding themselves in Coalition government, unsurprising given the last 60 years of elections. Nick Clegg did attempt to persuade the party to scrap this pledge towards the end of 2009, which would have been a politically wise move. It's worth noting that the LibDems could fulfil their pledge to the letter if they were in opposition, or in a looser electoral pact, in neither of these cases would they be able to influence the policy of the government so their opposition would be entirely decorative. No doubt many believe that LibDems should have given up Coalition government on this issue, that would have been stupid and pointless.


Politically I believe the appropriate response to not being able to fulfil the pledge is to say that the LibDems are sorry they did not receive a sufficient electoral mandate to enable them to fulfil this pledge and other manifesto pledges in coalition government. I note that more experienced government parties, such as Labour, have found it easy to brazenly ignore their pre-election pledges on tuition fees, twice, without little protest from the Labour dominated National Union of Students.


The discussion on tuition fees is made in a context where, in Liam Byrne's words "there is no money", all of the major Westminster parties proposed to address a large deficit mainly by making cuts to government spending, rather than raising taxation. In light of this, and the Browne report, making a bid for even flat central funding in the higher education sector was always going to be an uphill struggle.

I estimated previously that tuition fees could be replaced by an increase of 2p on basic rate tax, or 8p on higher rate tax and the Greens have proposed 4p on corporation tax to fund higher education. Those are tax increases of 10%, 20% and 15% respectively.  Clearly combinations of these three elements would also work. However, it must be recognised that higher education will always be in competition with other claims on the public purse. If you had £7bn to spend would higher education be your first priority? Or would it be schools, benefits, hospitals or tax cuts?

The scheme proposed by the Coalition does shift paying for university education further from general taxation. However, I believe Vince Cable has done a fair job of adding LibDemery to the Browne report, commissioned by Labour. In particular covering part-time education, capping tuition fees, and attempting to make repayment progressive. The principle difference to a pure graduate tax is that a tuition fee is stated, if not paid up front. A large number of people seem keen to imply that tuition fees will be payable up front, which they are not, and simultaneously claim that poorer students will be put off applying - perhaps because they have been repeatedly told fees will be payable up front.

As for what LibDem MPs should do when presented with the relevant parliamentary bill. It's quite clear that backbench LibDem MPs should abstain, those that vote against are free to do so but should suffer the consequences in terms of party discipline. Government ministers are in a less clear position, the Coalition agreement does allow for them to abstain, however particularly in Vince Cable's case, where he was heavily involved in developing the proposed legislation and feels happy with the results, it seems to me he must vote in favour - anything else just looks strange. There is a logic for all Liberal Democrat government ministers voting for the tuition fee proposals, this would be the case in a simple, one-party majority government.

In a coalition government, the policy of the component parties is not the same thing as the policy of the government. I tentatively believe the LibDems should retain an ambition to fund higher education from general taxation, I struggle to see how this policy will be implemented in the next 10 years but I do not feel this should rule out LibDems holding it as a policy. I believe, in future, the LibDems should avoid, like the plague, making pledges in the form that they made on tuition fees. They should also apply a disclaimer to their manifesto that they will negotiate to implement what they can from the manifesto but only in majority government will they pledge to deliver all policies.

Tuesday, November 09, 2010

Poor attendance record in the House of Lords?

I know my readers love a chart, and today I found some data I thought was begging for a good graphing. It’s the attendance figures for the House of Lords found in a report entitled “Members Leaving the House” – found at the bottom of this article. The motivation for the report is to explore the idea of retirement for peers, something some peers are seeking regardless of any other changes taking place. A secondary motivation is that there is wider reform of the House of Lords proposed, and one of the issues is that the new House is envisaged, ultimately to have substantially fewer members – this type of discussion informs how that transition might be achieved.

The report contains a set of tables for the last five years indicating the fraction of sessions which peers attended broken down into groups:

  • Attended 75% or more sessions
  • 50% to 74%
  • 25% to 49%
  • 10% to 24%
  • Attended at least once but less than 10%
  • Zero attendance

This is what the data looks like:

PeerAttendance

To give some idea of scale: across the period shown here the total number of peers decreased from 777 to 741, the average number of sessions in a year was 140, this latter figure means that a peer attending “less than 10% of sessions” was attending less than twice. It compares with the number of working days in the year of approximately 240 (48*5 day weeks). Nearly 20% of peers attend a session in the House of Lords only once or twice a year.

Being a member of the House of Lords isn’t a proper job, it does not attract a salary, although peers may claim a subsistence and office allowance of up to £26,000 per year. In this sense we should not anticipate the levels of attendance achieved by those working “normally”. Some of the peers will be paid as government or opposition working peers. However, peers do have a direct effect on the laws the country makes and turning up twice a year (which is all 20% of them achieve) does suggest a fairly low degree of interest – if I did something twice a year I wouldn’t even consider it a hobby, I go to the dentist more often!

Friday, November 05, 2010

A Coalition candidate for Oldham East and Saddleworth?

Following the news that Phil Woolas has lost his seat of Oldham East and Saddleworth for knowingly lying about his opponent, Graeme Archer has proposed on Conservative Home that the Coalition should put up a joint candidate selected in an open primary. Much as I respect Graeme on this I disagree, although I should point out this is a cautious rather than an emphatic rejection.

The function of a by-election is to selection an MP to represent a constituency in parliament, at a General Election this selection – repeated across the country – amounts to a decision on who should form the government. The General Election this year demonstrated that decision may not be clear.

Speaking from the point of view of a Liberal Democrat, potentially giving up the race in this seat would be damaging – it plays directly to the idea that the Liberal Democrats have been subsumed into the Tories. Should the LibDem candidate win in the Open Primary they would, almost inevitably be seen as the Coalition rather than the LibDem candidate. The great risk that the LibDems face during the Coalition is that as a minority party in a coalition they will be electorally damaged at the next General Election – this is observed in coalitions across Europe.

Successfully contesting a three-way election would illustrate how by-elections under coalition work, something that has been demonstrated already in the Thirsk and Malton by-election held over the summer. Furthermore it would help maintain the separate identity of the Liberal Democrats. I can join the Tory Party whenever I want, but I don’t want to – it is so blinding obvious to party members that the merger of the two parties is undesirable that amongst party members it is not even worth talking about. The public, and commentators need convincing of this.

From the point of view of the Coalition the situation is less clear cut, offering a combined candidate does demonstrate the joint nature of the Coalition, and the opportunity to argue the Coalition’s joint platform. However, at this point in a Government it would be difficult to see the by-election as a true referendum on their joint record, there are better ways of doing this than a by-election in a single constituency under special circumstances.

From a more practical point of view, as Tory Radio points out, it is more than likely that a faction within the losing party of the Open Primary would put up their own candidate.

Rather playfully I will point out to Graeme that the Open Primary followed by election scheme contains elements of an ad hoc election by alternative vote in the sense that there are multiple rounds of voting with candidates dropping out at different stages.

Why the other ways don’t work

In my last blog post I calculated how to raise money for various things (getting rid of tuition fees, avoiding any benefit reductions and so forth) using income tax; originally the more ranty bit to be found in this post was included, but it was getting a bit long so I separated analysis and rant.

Since the election there’s been a great deal of discussion of cuts, largely this has been framed in terms of a cut to X being apocalyptic where X is some area supported by its interest group. There has been rather less focus on what should happen in place of such cuts, proposing an alternative area for increased cuts has generally been tried: “waste, foreigners in the form of international development, benefit scroungers, Trident“ are ever popular – each of these contributes about £1bn or so per annum in spending – the gap we’re trying to match is about £80bn per annum. There have been some proposals for increased taxes to be paid by “someone else”, an increase in VAT met with considerable opposition (VAT is the third biggest element of tax – the change would raise about £13bn per annum), as was an attempt to cut child benefit for higher rate tax payers, raising about £2.5billion per annum.

The favoured targets for increased taxes are “the rich” and “tax avoidance”. “The rich” are normally defined as “richer than me and the people I know”, which is a poor definition. Tax avoidance, according to an HMRC report under the last government the size of the tax gap – the sum of avoidance (legal) and tax evasion (illegal) was around £40bn per annum. This is disputed with Tax Research UK giving a figure three times larger at £120bn. It’s difficult to see exactly how they manage such a high estimate – it’s seems to be based around the size of the “shadow economy” – things like illegal working. Regardless of this actually collecting the money involved in the tax gap would appear to be difficult: as announced by Danny Alexander there’s a hope that spending £200million per year will result in a tax recovery of £7bn per year. There’s an implicit assumption in tax avoidance that again it’s “the rich” who are responsible but it seem clear from reading the HMRC document that successfully addressing the tax gap would probably impact quite broadly. For example, buying wine in Calais is a tax avoidance; as is paying the builder, decorator and so forth in cash; as is purchasing items in Hong Kong via ebay. The company I work for has changed the way it pays some of my pension contributions to reduce the tax paid – presumably this would count as a tax avoidance too.

Vodafone is in the news at the moment for a £6bn tax avoidance. The £6bn figure is as calculated by Private Eye and is described by HMRC as “an urban myth”; Vodafone appears to have made provision of £2.2bn to address this issue and ultimately paid £1.25bn. It’s worth pointing out that the £6bn figure, accrued over 10 years is typically compared by protestors with a *yearly* benefit cut of £7bn. This sort of presentation leads me to believe that the proposer is somewhere on the innumerate-dishonest scale and discount whatever else they are saying. Taking the Private Eye “high” estimate this is £600million per year, taking the difference between the amount actually paid and the “low” estimate it amounts to £100million per year. Vodafone appears to have paid around £1bn tax on profit in 2009 amounting to a rate of 25% in that year, so it is not true that they pay “no tax”. It’s also worth noting that Vodafone appear to have the legal upper hand in the situation, given a judgement in the European Court of Justice.

At one time Trident or its replacement were cited as a source of ready cash – again the presented cost of up to £100bn is for the entire lifetime of the system of up to fifty years or so i.e. between £1bn and £2bn a year, regardless of this the decision on Trident has been pushed into the future (i.e. beyond the next election). A more likely figure for the Trident replacement is £20bn, or at most £34bn. I’ve said previously that I consider Trident to be Cold War willy-waving but scrapping it is not a big impact – particularly if there is any sort of replacement.

A useful rule of thumb for all these situations seems to be:

  1. Check that tax gain and spending are being compared on the same time period.
  2. Divide quoted tax gain by at least three since that will get you back to a more generally accepted figure.

The latest wheeze is chasing George Osborne for a £1.6million tax bill. Referring to our list above, (1) is met admirably this bill would be payable once, on the death of his father. Experience suggests the figure of £1.6million is fanciful. David Mitchell puts this so much better than me here in the Observer. It’s not that I am in favour of tax avoidance I just see efforts to address the problem by individual harassment as pointless. What is needed, as Mitchell points out, are changes in the law so that tax avoidance becomes tax evasion and is then illegal. It’s ridiculous to expect people to pay tax that they don’t legally have to – it’s not what the great majority of the population do – why expect companies and the rich to do any different?

I’ve yet to see any figures on the “cut avoidance through growth scheme”, a priori I’m dubious since the ability of government to influence growth seems marginal and any scheme would need to stretch out beyond the 10 years that even Labour were planning to cut the deficit in by which time using my state-of-the-art recession prediction algorithm we will have experienced another recession, and another addition to the deficit.

I’m uncomfortable with the idea that we should demand services (no tuition fees, protected benefits) but rather than seeking a way to contribute to paying for these services personally try to push the payment for them onto a small fraction of the population. If you demand more money for X but don’t expect to pay any more for it then frankly I don’t think you’re committed to the idea.

Sunday, October 31, 2010

Yields from income tax

This post is a tour of income tax and personal national insurance yields, it’s motivated by an interest in seeing how one might pay for a part of the reduction in the deficit through taxation. The reason for focusing particularly on income tax is that it yields a fairly large fraction of the total tax income (28.7% in income tax and 46.6% income tax and national insurance combined), as discussed in a previous post; this means that relatively large amounts of money are raised by relatively small changes when compared to other taxes. Furthermore it’s relatively easy to calculate: I can work out how much income tax I pay in a year but would struggle to tell you how much VAT I pay per year, the impact of a tax on insurance premiums the effect of a change on duty and so forth. Thirdly, it is the tax that is most transparently progressive, in the technical sense that the more you earn the greater the fraction of your income you pay in tax.
This calculation is based on a calculation of personal tax rates from wikipedia, this figure generates the tax rates programmatically and I simply translated the code to my computer language of choice – I thought about doing it in a spreadsheet but that turned out to be a bit brainbending. The second component of the calculation is the number of people in each income bracket: this information along with further information on incomes can also be found on wikipedia. Ultimately the data come from the HMRC. I’ve put these two bits of data together into a program which enables me to fiddle with tax rates, tax thresholds and so forth. It appears to be approximately correct since it matches roughly HMRC’s own figures on the effects of small perturbations to the tax system (pdf). This also tells you it’s possible to look this stuff up – but I find it more fun to calculate it myself! It’s also a good illustration of the general process of how to go about repeating someones calculations from literature sources: try to reproduce their graphs; try to match the summary numbers they produce.
This first figure shows the income and national insurance payable as a fraction of gross (total) pay as a function of pay. The thing I hadn’t appreciated intuitively is that the tax banding system gives quite a smooth increase in percentage tax take, this is because you only pay raised rates on the fraction of your income that lies above the threshold:
TaxRatesAsAFunctionOfIncome
Extending the horizontal scale out towards incomes of £1,000,000 and the rate tends to 50%. The next figure shows the distribution of incomes, in the UK:
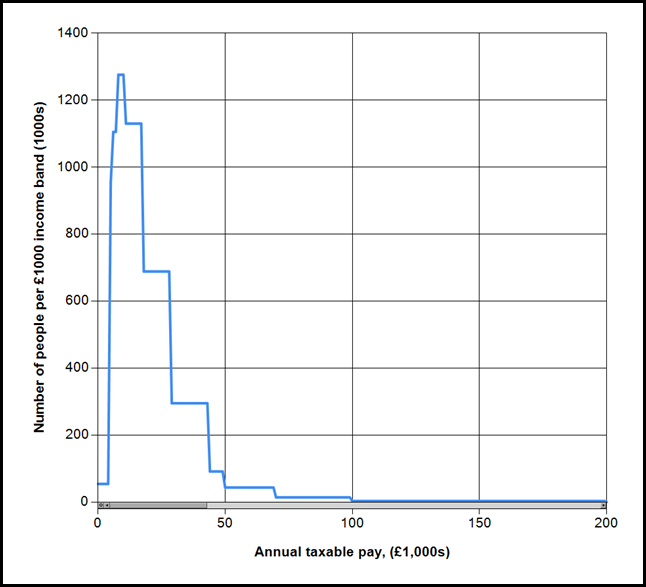
PopulationAsAFunctionOfIncomeBand
You can see the same information in text form here. The area under this curve between points on the horizontal axis tells you the number of people in an income band. The median income in the UK is £26k per annum – half the population earn more than this, half less. About 1% of the population earns more than about £100k per annum. This final figure shows the amount that each income band pays according to the latest tax rates.
TaxPaidAsAFunctionOfIncomeBand
To summarise this final figure in tax bands, the 20% band accounts for about 57% of tax paid, the 40% band for 26% and the 50% band for 17%. These bands contain respectively 90%, 9% and 1% of the income tax paying population.
In case you’re curious my salary puts me close to the top of the basic rate tax band.
To apply the knowledge embedded in these graphs to some recent problems:
As a rule of thumb: 1p on basic gives about £4bn, 1p on upper rate gives £0.75bn, 1p on the new 50% band gives £0.31bn. The reason for this sharpish dropoff is that relatively few people are effected by the upper rate tax changes so to yield a large tax income the rates have to be changed by a relatively large amount.
Reducing the threshold of the 40% tax band to £40k from £43k yields about £3bn.
The £20billion cut in welfare benefits is equivalent to approximately 5p on the basic rate of income tax, taking it to 24.5% from 20%. This would cost me about £1700 per year.
Tuition fees cost about £7.5billion (based on 1.5 million students each requiring an average £5k tuition fees per year), this is about 2p on basic rate. This would cost me about £800 per year.
The £2.5billion income gained from cutting child benefit from those in the upper tax band could be paid for with an increase in the upper rate to ~43% from 40%. Although it seems the £2.5billion figure is dubious. I can’t help thinking simply increasing the upper rate by this amount, rather than a convoluted attempt at clawback would be simpler. This isn’t to say I support the idea of paying child benefit to all regardless of income, just that implementing withdrawal in this way is technically complicated. This tax rise wouldn’t cost me anything!
I’ve not seen anybody volunteering for these tax increases to support their favoured causes, rather they prefer a range of schemes of dubious value impacting other people to avoid the problem falling upon themselves – a subject for my next post.
Note
This modelling was done using Visual C# running under Windows 7, if you’re interested either in the code or in just the application then let me know in the comments below (or on twitter). There are a couple of minor bits of tidying I’d like to do before release. Please note that the application is “good enough for blogging work” and should not be considered an accurate tool for tax calculations – it’s a toy to help me understand things!

Wednesday, October 27, 2010

Questions for undergraduates… cabinet edition

Thinking back many years to my first fraught days as an undergraduate, the three questions that came up most frequently as icebreakers between students were:

  1. Where are you from?
  2. What were your A-level results?
  3. What degree are you doing?

In this post I thought I would answer the third question, for members of the cabinet. The data is all culled from wikipedia:

Prime Minister David Cameron Politics, Philosophy and Economics (Oxford)
Deputy Prime Minister Nick Clegg Social Anthropology (Cambridge), Political Philosophy (Minnesota), MA European affairs(College of Europe)
Foreign and commonwealth affairs William Hague Politics, Philosophy and Economics (Oxford), Master of Business Administration (INSEAD)
Chancellor of the Exchequer George Osborne History (Oxford)
Justice Kenneth Clarke Law (Cambridge)
Home department Teresa May Geography (Oxford)
Defence Liam Fox Medicine (Glasgow)
Business, Innovation and Skills Vince Cable Economics and Natural Sciences (Cambridge), PhD Economics (Glasgow)
Work and Pensions Iain Duncan Smith Sandhurst
Energy and Climate Change Chris Huhne Certificate in French language and civilisation (Sorbonne); Politics, Philosophy and Economics (Oxford)
Health Andrew Lansley Politics (Exeter)
Education Michael Gove English (Oxford)
Communities and local government Eric Pickles Law (Leeds Polytechnic)
Transport Philip Hammond Politics, Philosophy and Economics (Oxford)
Environment, food, rural affairs Caroline Spelman European Studies (Queen Mary College)
International Development Andrew Mitchell History (Cambridge)
Northern Ireland Owen Paterson History (Cambridge)
Scotland Michael Moore Politics and Modern History (Cambridge)
Wales Cheryl Gillian Law
Culture Olympics Media and sport Jeremy Hunt Politics, Philosophy and Economics (Oxford)
First secretary to the treasury Danny Alexander Politics, Philosophy and Economics (Oxford)
Leader of the House of Lords The Lord Strathclyde Bachelor of Arts (UEA)
Minister without portfolio The Baroness Warsi Law (Leeds)

As a scientist this is both depressing and comforting, depressing because of 23 members only 2 has any sort of scientific training: Liam Fox and Vince Cable (the latter of whom only did science in his first year). Comforting because at least we don’t get the blame!

It also highlights once again the dominance of the Politics, philosophy and economics degree at Oxford in providing Cabinet ministers – I haven’t checked but I believe this applies to previous cabinets.

Thursday, October 07, 2010

Children and numbers

One of this mornings news items is on government plans to limit benefit to a family to the average wage, apparently regardless of the size of the family. This seems to be built around the idea that there are families out there with vast numbers of children who are milking the system to the cost of the rest of us. We can check this idea with numbers. The graph below shows the number of claimants broken down by number of children in the household, the final category is for families containing 8 or more children.
Picture1
The heights of the columns are a lower bound on the fraction of benefit going to each group, an upper bound would be to multiply each column by the number of children but this would be an over-estimate since benefits don’t increase linearly with number of children. There are a little under 1000 families with 8 children or more. 90% of claimant families have less than four children.
These data tell us nothing about the circumstances of each of the families represented which will include the loss of parents, illness, job loss and all the other small disasters which can befall a family.
The data shown here are from Department of Work and Pensions via The Spectator (here).

Wednesday, August 18, 2010

100 days later: A Lib Dem view

I woke this morning to the sound of a bandwagon rolling past, grabbing my keyboard I jumped aboard. It is 100 days since the Coalition formed following the General Election. For people wedded to the decimal system of counting 100 is a nice round number, for programmers of a certain generation 128 is preferable. Perversely the Marquis de Sade chose 120 days, but I can't wait 20 days.

As a member of the Liberal Democrats for 20 years, I thought my opinions on a 100 days of partly Liberal Democrat government might be interesting to at least a few people. You can see my previous political postings here, to get a bit more context.

Things I'm pleased about:
Pupil premium; a rising lower tax threshold; increased capital gains tax; Ken Clarke sounding like a liberal on prison policy, an end to ID cards and over-enthusiastic lawmaking for every occasion; some hope of constitutional reform both in the Lords and for general elections;  no changes to the married tax allowance;

I'm also pleased by the very existence of a coalition government, it seems far more healthy to me that government is composed of members from two parties representing a majority of voters in the country, rather than one party who through a quirk of the electoral system has scraped in with a majority of seats based on a minority of votes. Far better coalition than more opposition where our influence is minimal.

I see my vote as delegating my views to the Liberal Democrats based on their manifesto, if they were in government alone I'd expect them to attempt to implement the entire manifesto (even if I didn't like all of it). In coalition I expect them to negotiate using that manifesto as a basis, the fact that the entire manifesto is not being implemented is a result of them not achieving an overall majority. The inability to implement the entire manifesto is a fact of electoral arithmetic.

Things I'm not so pleased about:
fatuous comparisons of civil servant pay with the Prime Ministers pay; ostentatious "dipping of hands in blood" following the Budget, at times it felt like the only people cabinet ministers defending it were Liberal Democrats; David Laws' rapid exit from government; Trident - I'm not particularly anti-nuclear but now was the perfect time to get shot of a piece of Cold War willy-waving.

As far as the economy is concerned, I believe we'd be in approximately the same place as we are now regardless of which party was in government prior to the election. The logic of this is also that regardless of who would have won the election they would have ended up doing approximately the same thing now (or in the near future): cutting government spending fairly dramatically. Arguments about timing are largely political; economics, it seems to me, is a "science" too imprecise to tell us much about the future and the fervent calls for cuts now, or cuts later are largely political. There is some marginal argument about the scale of the cuts, but given a Labour government we would be facing cuts of broadly the same magnitude.

I suspect there is a lot of departmental spinning going on at the moment: they've been asked to make fairly large cuts and they're leaking the ideas for cuts that they know will be politically the most unpalatable in order to give themselves some leverage for the spending review.

There's much enthusiasm about the LibDem's apparent problems in the polls, however they're generally at levels comparable with the last 10 years or so (see the Guardian Datablog). They are only low if you compare them to the heady heights of the election campaign which were quite evidently wildly inaccurate - the only accurate poll was the exit poll. I suspect a LibDem party in coalition with Labour would find itself in very much the same position.

It's worth highlighting again the inequity of first past the post system: plug the latest opinion poll into the BBC's calculator: (Lab:37% Con: 37% LibDem: 18%) and you get (Lab: 336 Con: 244 LibDem: 42). Labour get a 92 seat advantage over the Tories for an identical percentage of the vote and they get  8 times the number of seats as the Liberal Democrats for twice the vote. The Electoral Reform Society did a report for "Conservative Action for Electoral Reform", on this subject - interesting conclusion is that equalising constituency size doesn't really address the problem.

After the General Election the Liberal Democrats had three options: one it seems was unworkable, one was simply lazy, we chose to do the other thing. The only principle the Liberal Democrats have given up is the principle of not being a party of government.

Sunday, August 15, 2010

Journalists unable to cope with the conditional?

A short rant on the newspapers today. Is there something in the style guides that says either something must happen or something is not happening? I take as an example, this piece in the Observer:

In its first few months in government, the coalition has delivered one major housing reform after another – from plans to cut down on "garden-grabbing" to crackdowns on housing benefit and the unexpected announcement by the prime minister that council tenants would no longer be guaranteed a right to lifetime occupancy.

This (emphasised) statement is simply not correct. Or it’s only correct if you believe it’s an accurate reflection of this reply the prime minister made to a question at a PM Direct event:

At the moment we have a system very much where, if you get a council house or an affordable house, it is yours forever and in some cases people actually hand them down to their children. And actually it ought to be about need. Your need has got greater ... and yet there isn't really the opportunity to move."

"There is a question mark about whether, in future, should we be asking, actually, when you are given a council home, is it for a fixed period, because maybe in five or 10 years you will be doing a different job and be better paid and you won't need that home, you will be able to go into the private sector....

"So I think a more flexible system - that not everyone will support and will lead to quite a big argument... looking at a more flexible system, I think makes sense.

I’m a simple scientist not trained in the intricacies of the English language (particularly the apostrophe), but even I can tell the difference between asking a question and making a definite statement of policy. It seems important to me that events should be reported accurately and not simply re-worded to suit your prejudices. The article I quoted here is actually quite good, and interesting, but given this example of a deviation between what was said and what was written, how can I trust the rest of it?

*Preparation for this blog post hindered by @HappyMouffetard’s Tourette’s Syndrome breaking out whenever she hears the voice of David Cameron.